Deltas
Using Geographic Information Systems and Remote Sensing
Land Use at Mekong Delta


The following images have been downloaded from the GLCF website, they have then been unzipped and through ERDAS they have been layer stacked to create an image which can be manipulated. These images where then sharpened in ArcMap and are subsets of larger datasets.
This is a 1989 Landsat 4 image which is a true coloured image, bands 321. The original image was a bit dull and hazy until it was sharpened to make the image more crisp. This image shows the delta and it can be seen that there are different types of land use. However, from this image it can not be distinguished what the different types are.
For further development from the true colour the 1989 image has been changed to the band combination of 432 which is known as the False Colour or Near Infrared. It shows the water boundaries more clearly and the vegetation is much more apparent. The red showing on the image indicates that the land is vegetated. An interesting feature showing up on this map is that it seem there is quite a lot of waterlogged land or bare soil, ie the very light blue colours. Through research and investigation it seems that some of this land is rice crops in different stages of growth and also at this period there was a boost in shrimp growing (Geospatial Innovation Facility 2008).

The use of the band combination (453) here clearly shows different vegetation types with the land and water clearly distinguished. In some ways it is clearer than the near infrared image, instead of varying shades of the same colour the different vegetation types have completely different colours. Variations in moisture content are visible with this set of band combinations (Geospatial Innovation Facility 2008).
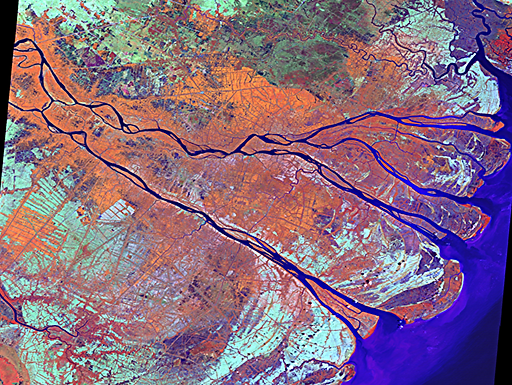
This image with a RGB of 742 is better for visualizing agricultural vegetation, this colour composite is very similar to that of 542 and show very similar things which is why only this image is displayed instead of both. Vegetation on this image is illustrated in the shades of greens, while the pink colours are categorized as bare soil. With this in mind it means that a better interpretation of the land use has been made with this band combination compared to that of the near infrared image. This band combination is often known as the pseudo natural colour (Geospatial Innovation Facility 2008).


This final 1989 image is in the bands of 555 which creates the black and white composite. It shows the boundaries between land and water quite well however it is not particularly useful for identifying land use types.